Hideky

Most of the work happens before anything gets built.

Two days reading the process, mapping how it actually runs and writing down the constraints. Then a system gets built, put in front of the operation, and rebuilt wherever it fights back.

Systems built
8
Largest user base
~800
Field teams coordinated
24
Years of design behind it
8

Three people, 24 field teams, one WhatsApp group.

A Mercado Livre World Cup activation, one month long: 24 field teams, about 144 people, across assembly, monitoring, teardown and crew meals.

Coordination ran through a WhatsApp group. The client had to ask for a status update every single time they wanted to know where anything stood.

The dashboard in the next section came out of that month, not out of a brief.

That is the pattern worth naming, and it repeats. A technical course in logistics explains axle weight and vehicle rotation rules. A month in the field explains why nobody updates a spreadsheet at two in the morning. Both end up as decisions inside an interface.

Method

Read the process.

Write the constraints.

Build the first useful version.

Watch it fail in use.

Then it gets good.

Cloudy Mountains, Fang Congyi, c. 1360–70
Cloudy Mountains, Fang Congyi, c. 1360–70 The Met · Public domain

Selected work

Routing that argues its own case

Promosapiens / internal logistics

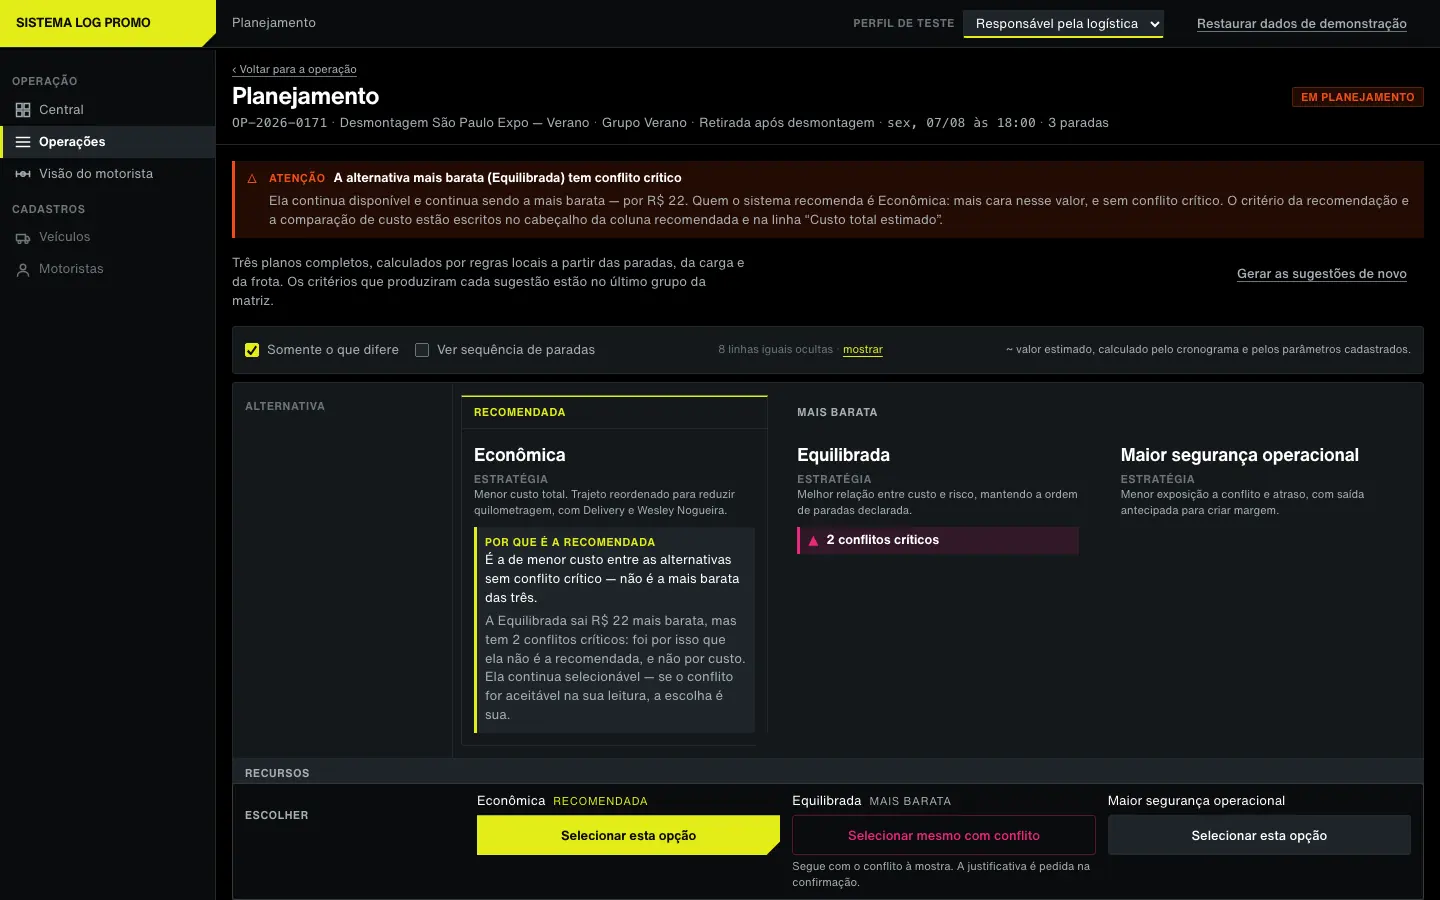
Stops, available vehicles, load, weight, cargo volume, vehicle restrictions, São Paulo rotation rules and cost go in. Three complete plans come out, side by side, with the conflicts each one carries spelled out.

One is recommended, and the reasoning is written down next to it. When the cheapest plan is not the recommended one, the screen says so in plain language and still lets you pick it. The decision stays with the person.

Screens
6
Variables weighed
8
Plans compared
3 per operation
Status
Prototype

Internal prototype, not yet in use. The costs on screen are provisional parameters, not quotes, and there are no operational results to report. The weight, volume and rotation logic comes from a technical course in logistics, not from guessing what a truck can carry.
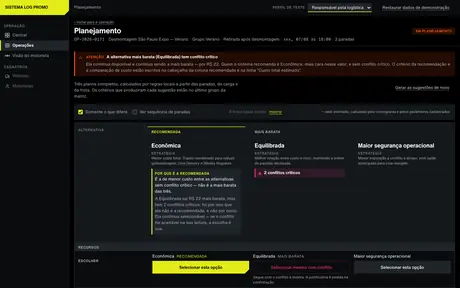
Comparison screen showing three routing plans side by side, each with cost, strategy and conflicts.

The comparator. Three plans, the recommendation, and the reason it is not simply the cheapest one.

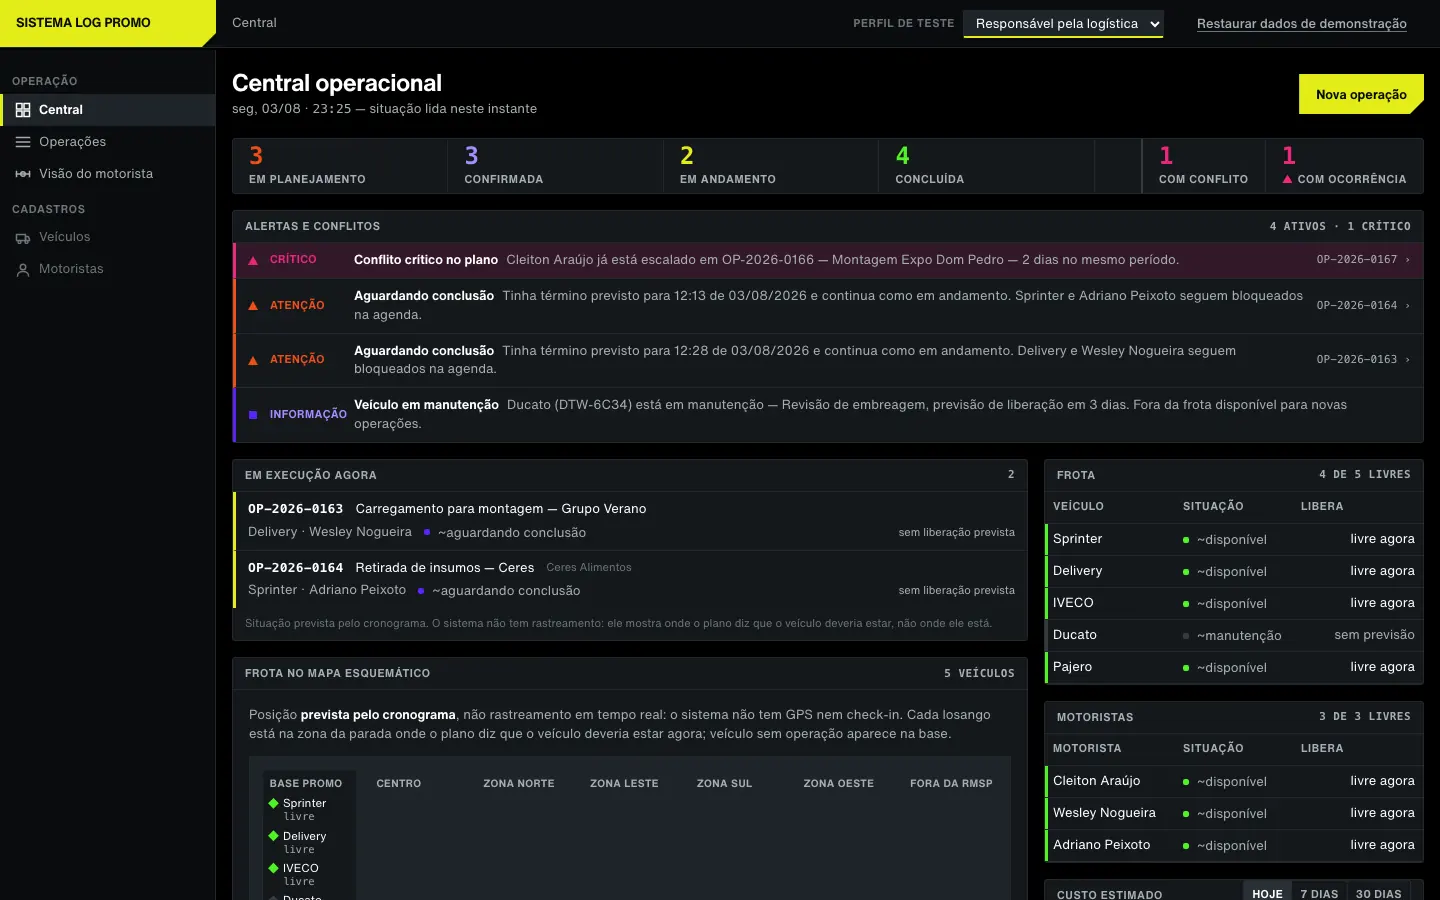
Operations dashboard listing active field operations with status and schedule.

Operations desk. Everything running right now, in one screen.

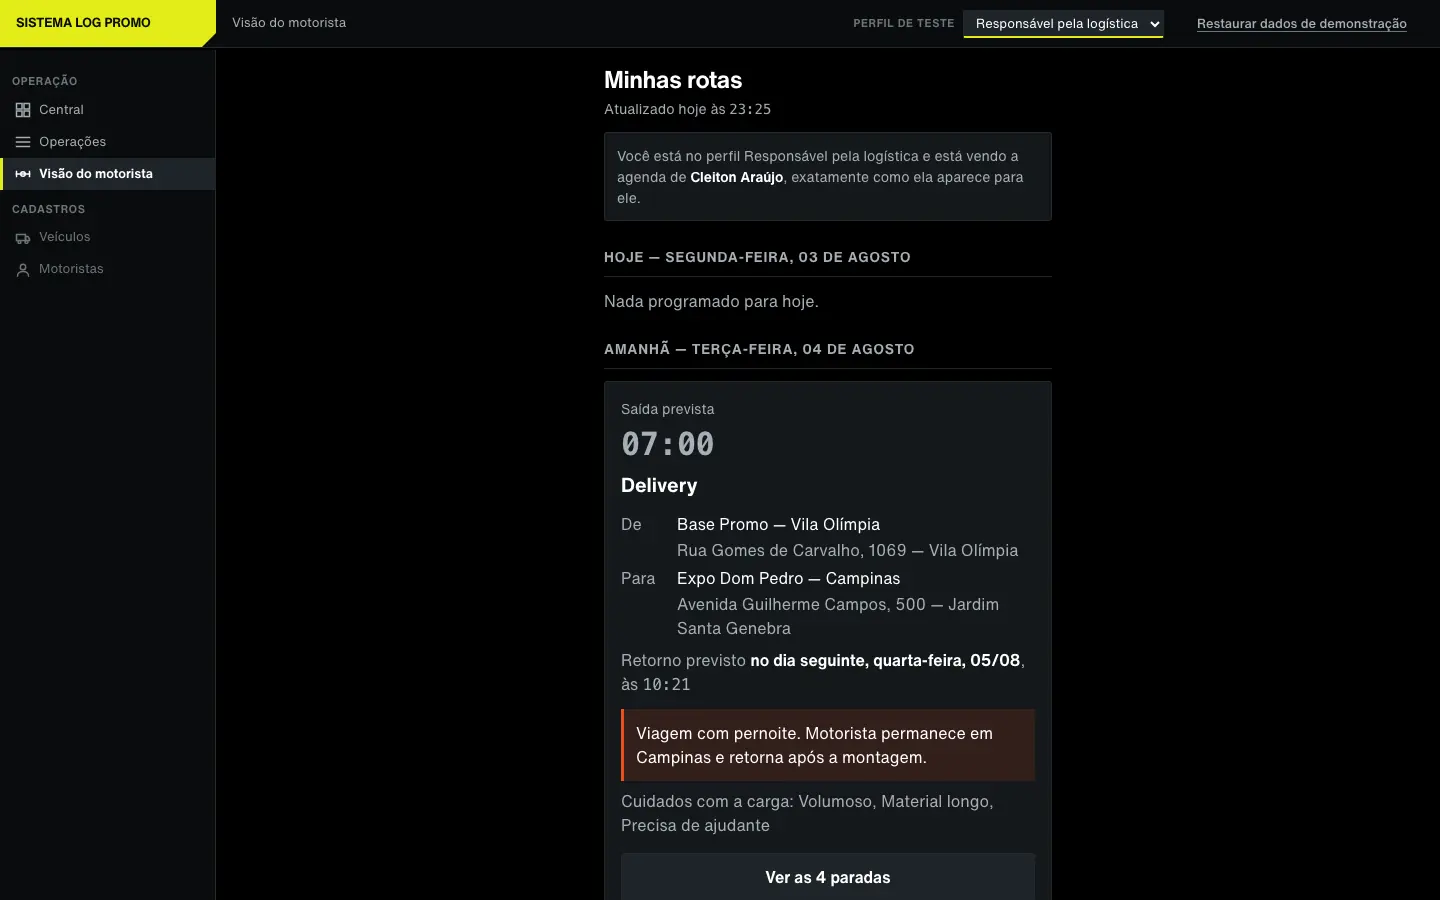
Driver view showing the assigned route and stop sequence.

Driver view. The same plan, reduced to what the driver needs.

Mobile recruiting units on a map

Mercado Livre / commercial preview

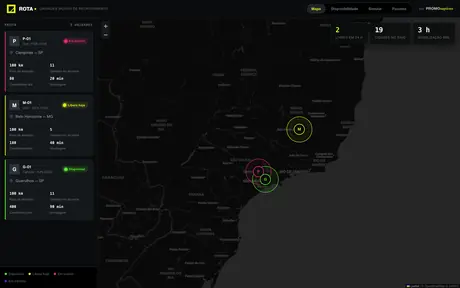
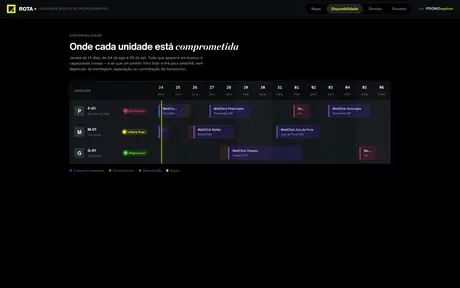
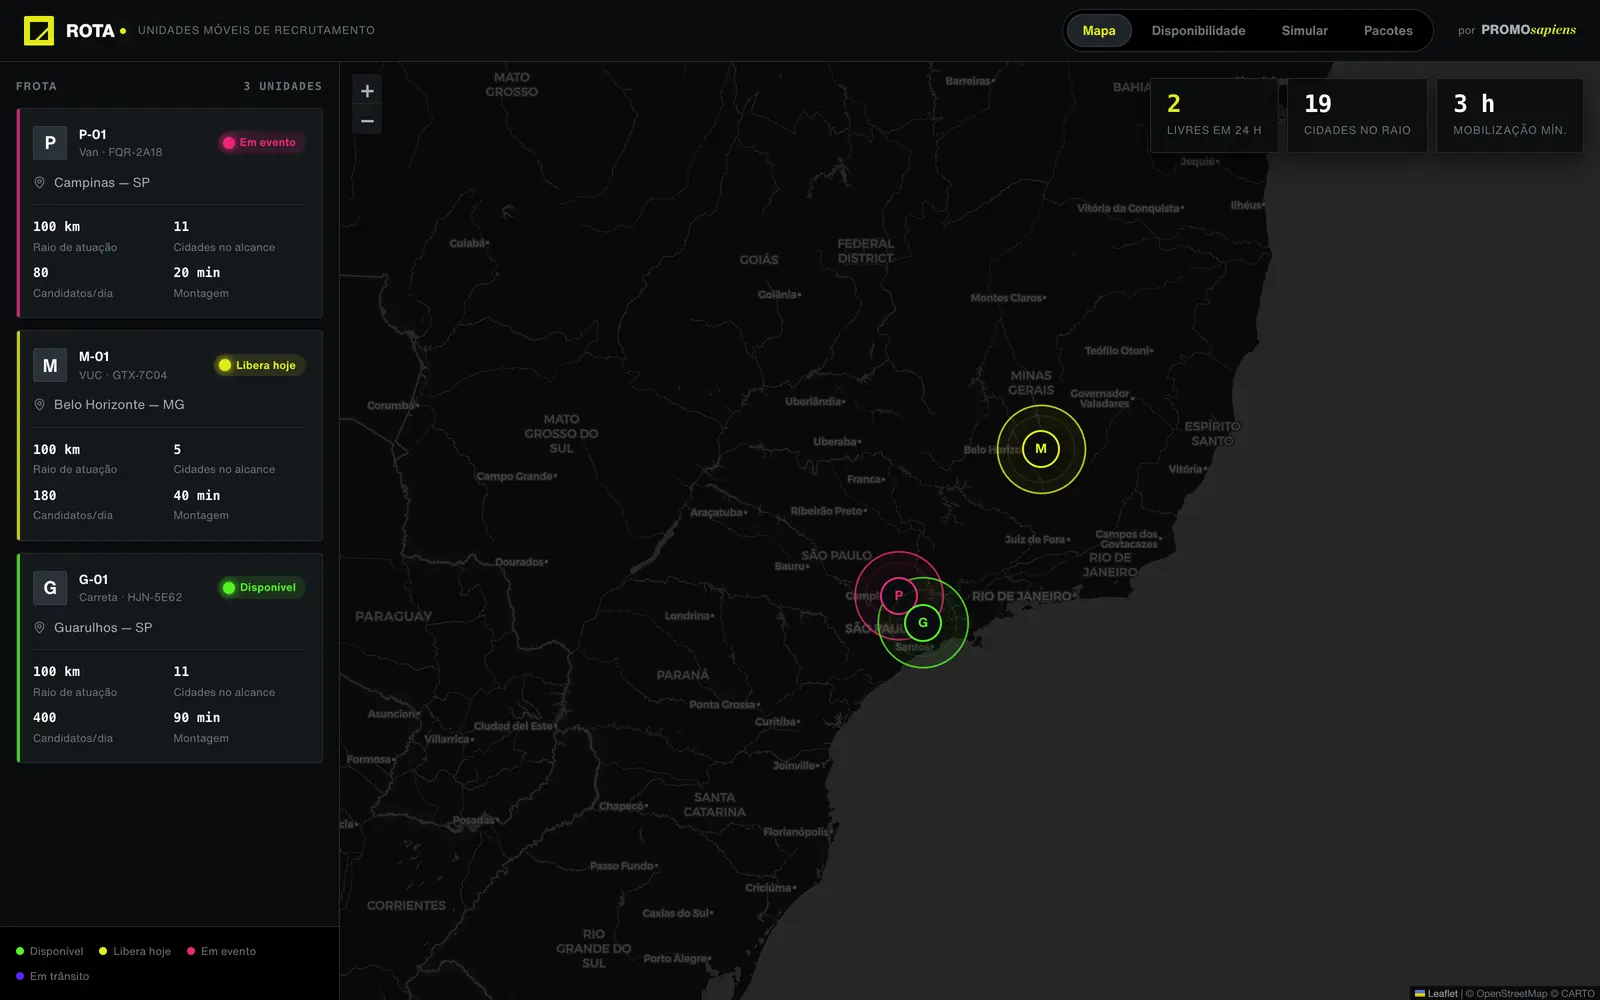
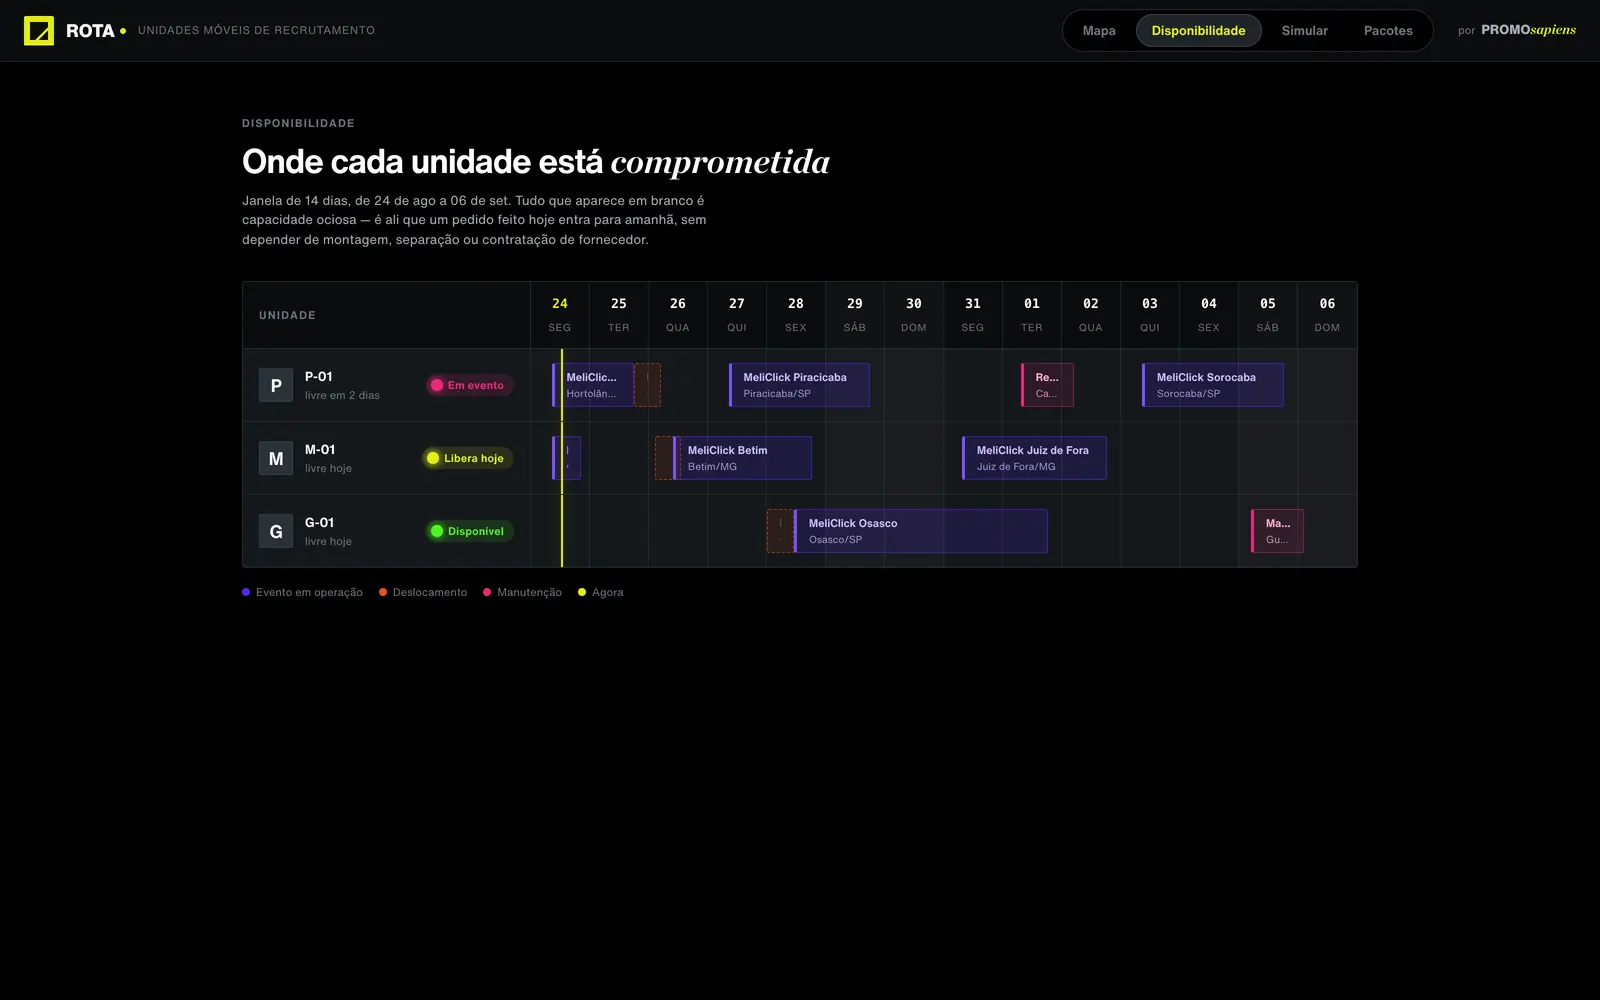
Three mobile units, each covering a 100 km radius. The panel answers the only two questions the client ever asked: where is the fleet, and when can it be somewhere else.

Pick a city and a date and it names the unit that can take the job. Built as a commercial preview, which set the real constraint: the operating model had to read as credible before a single vehicle existed.

Units
3
Coverage
100 km each
Views
4
Data
Illustrative
Dark map of southeast Brazil with three mobile units and their coverage radius.

Fleet map. Coverage radius drawn per unit, over live map tiles.

Availability grid showing fourteen days of schedule per mobile unit.

Availability. Fourteen days per unit, so a date question takes one glance.

Two B2B storefronts

Syngenta / Nidera and NK

Two branded internal stores, one per brand in the group, each with its own audience and catalog, replacing ordering scattered across WhatsApp and email.

Users
~800
Orders
~300
To delivery
~3 months
Storefronts
2

Discontinued, and the reason is the interesting part. Orders started arriving organized, fulfillment could not keep up with the volume, and the bottleneck moved downstream. The software reorganized demand faster than the operation behind it could absorb.

Work order standardization

Mercado Livre

A shared spreadsheet, edited live by several teams while events were running, produced rework, cancellations nobody recorded and invoicing that stalled. One record per order replaced it.

Volume
~20 a month
Users
~40
Built in
~1 month
Status
Pilot

Pilot in rollout. The team is still adapting, so there is no consolidated efficiency figure yet.

Integrated internal ERP

Promosapiens

Client services, quoting, production, creative and finance in one system, replacing a stack of Trello, Conta Azul (accounting SaaS) and spreadsheets. The requirements came out of sitting with all five departments, one at a time, and writing down how each one actually works rather than how the org chart says it does.

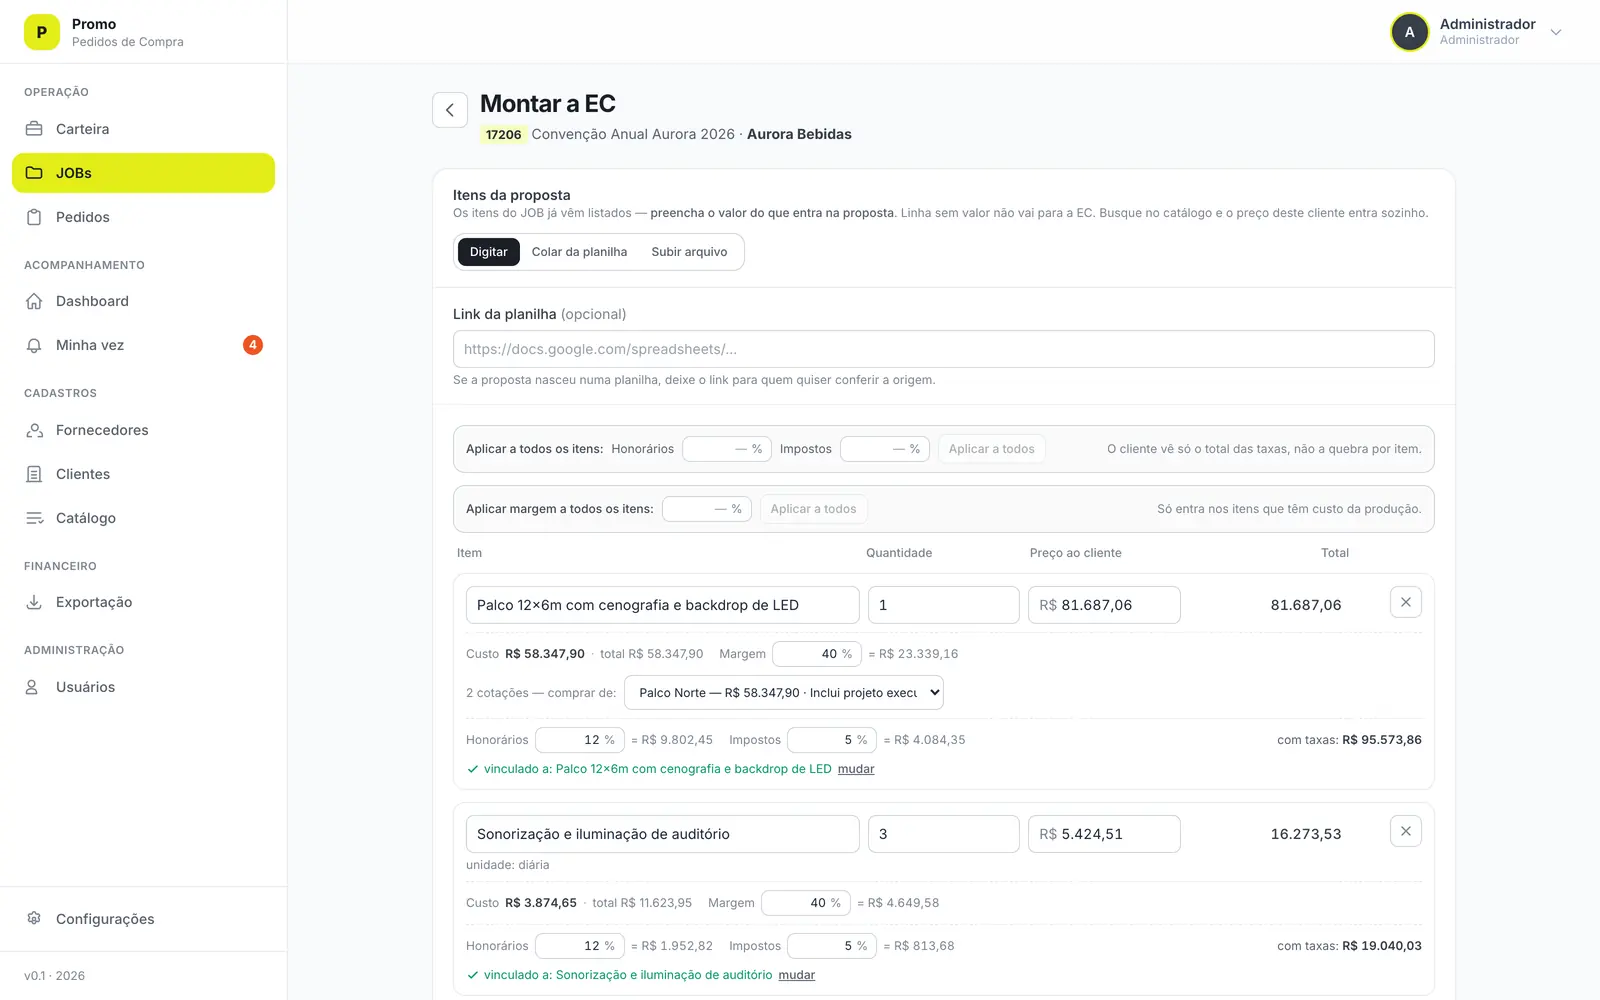
The quoting screen is where the work is: cost per supplier, margin, professional fees and tax, calculated per line, so the number the client sees and the number the company keeps never drift apart.

Departments
5
Users planned
~30
Team
One person
Status
In development

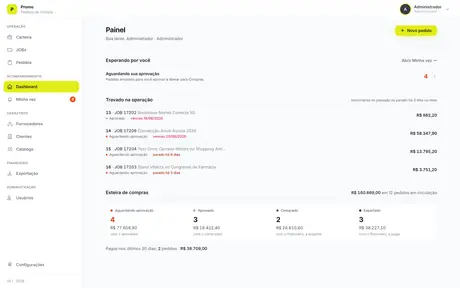
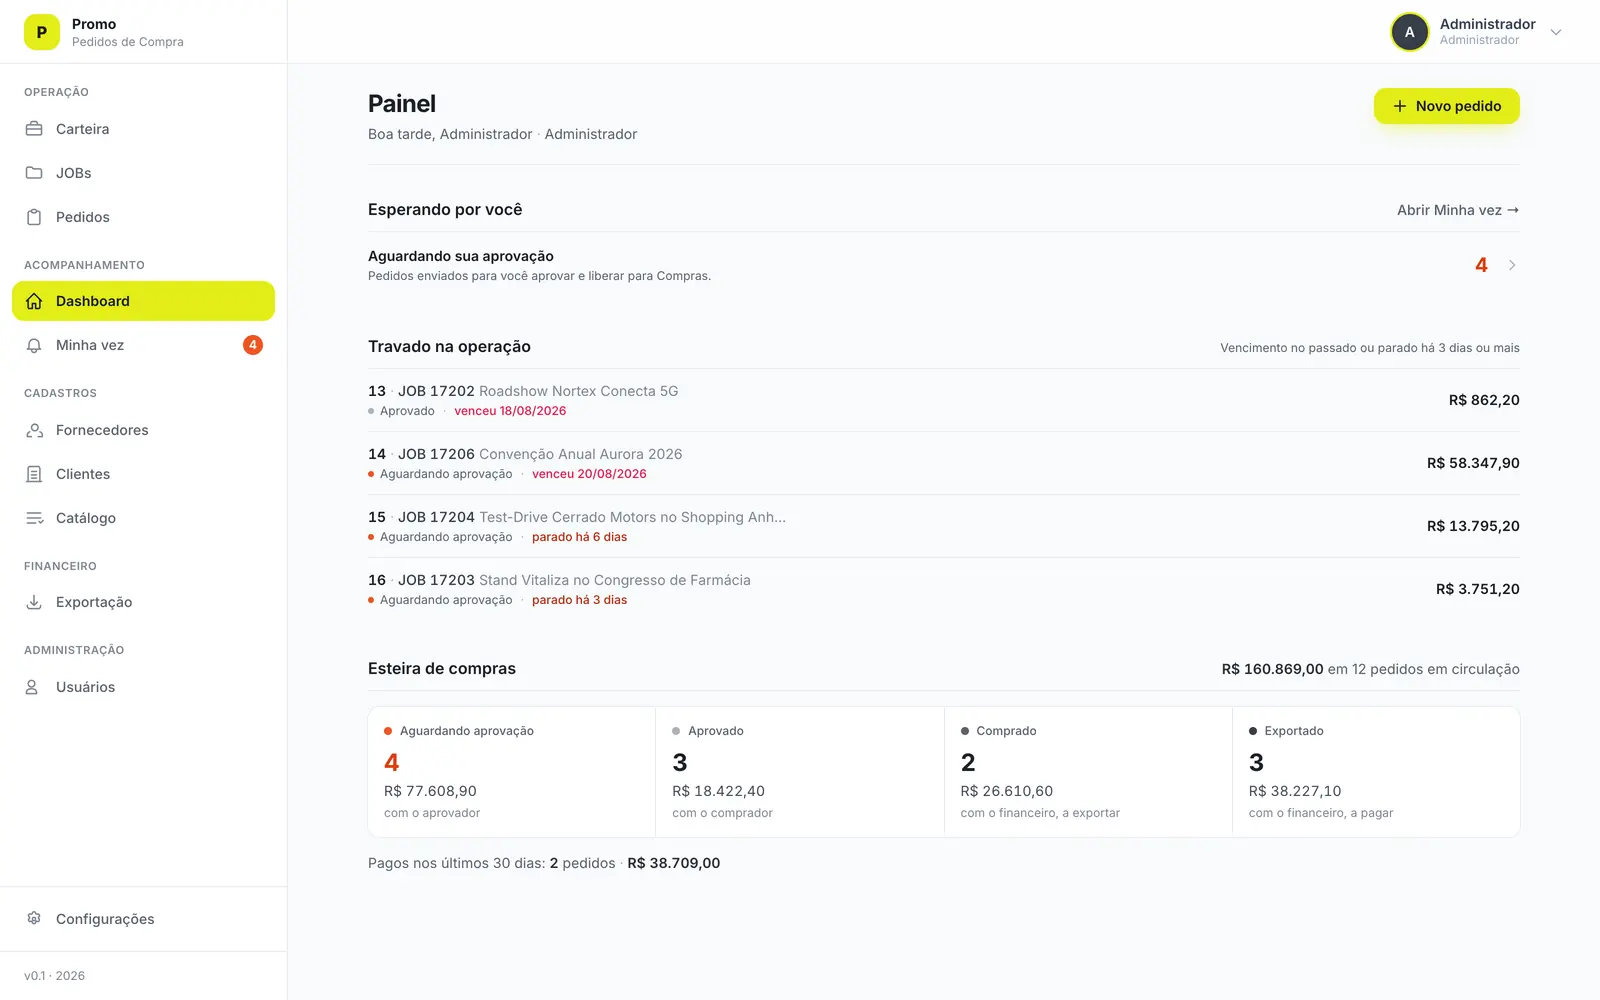
In development. The hard part was never the screens: it was holding five departments as one system instead of five isolated tools. Screens below run on invented data, seeded for this page.

ERP dashboard showing pending approvals, stalled orders and the purchasing pipeline by status.

The panel. What is waiting on you, what is stuck, and how much money sits at each stage.

Quote builder showing per-line cost, margin, fees and tax for each proposal item.

Quote builder. Cost, margin, fees and tax per line, with the supplier quote attached to each one.

Three branded trade-show games

Epson, Midea and Mercado Livre

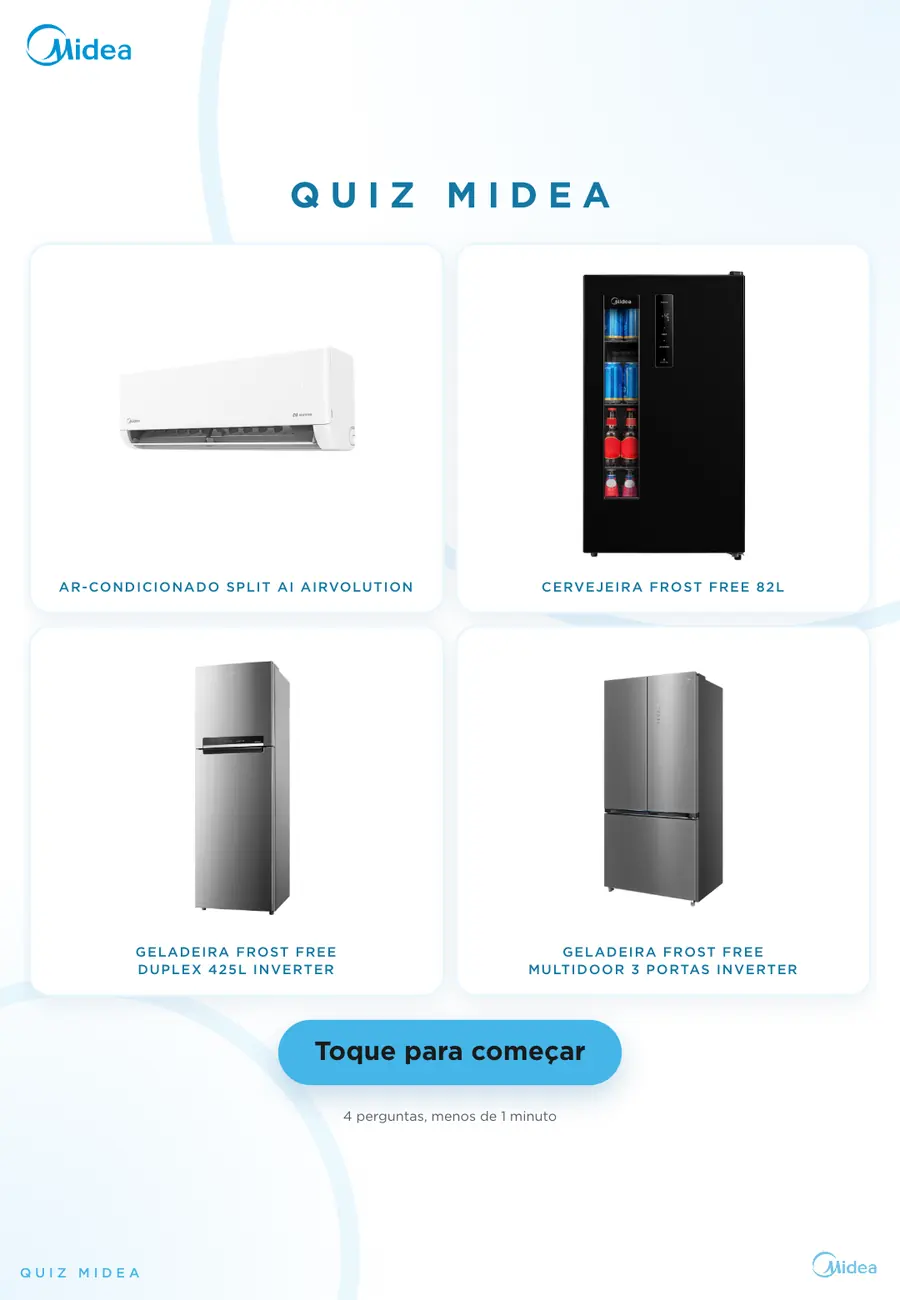
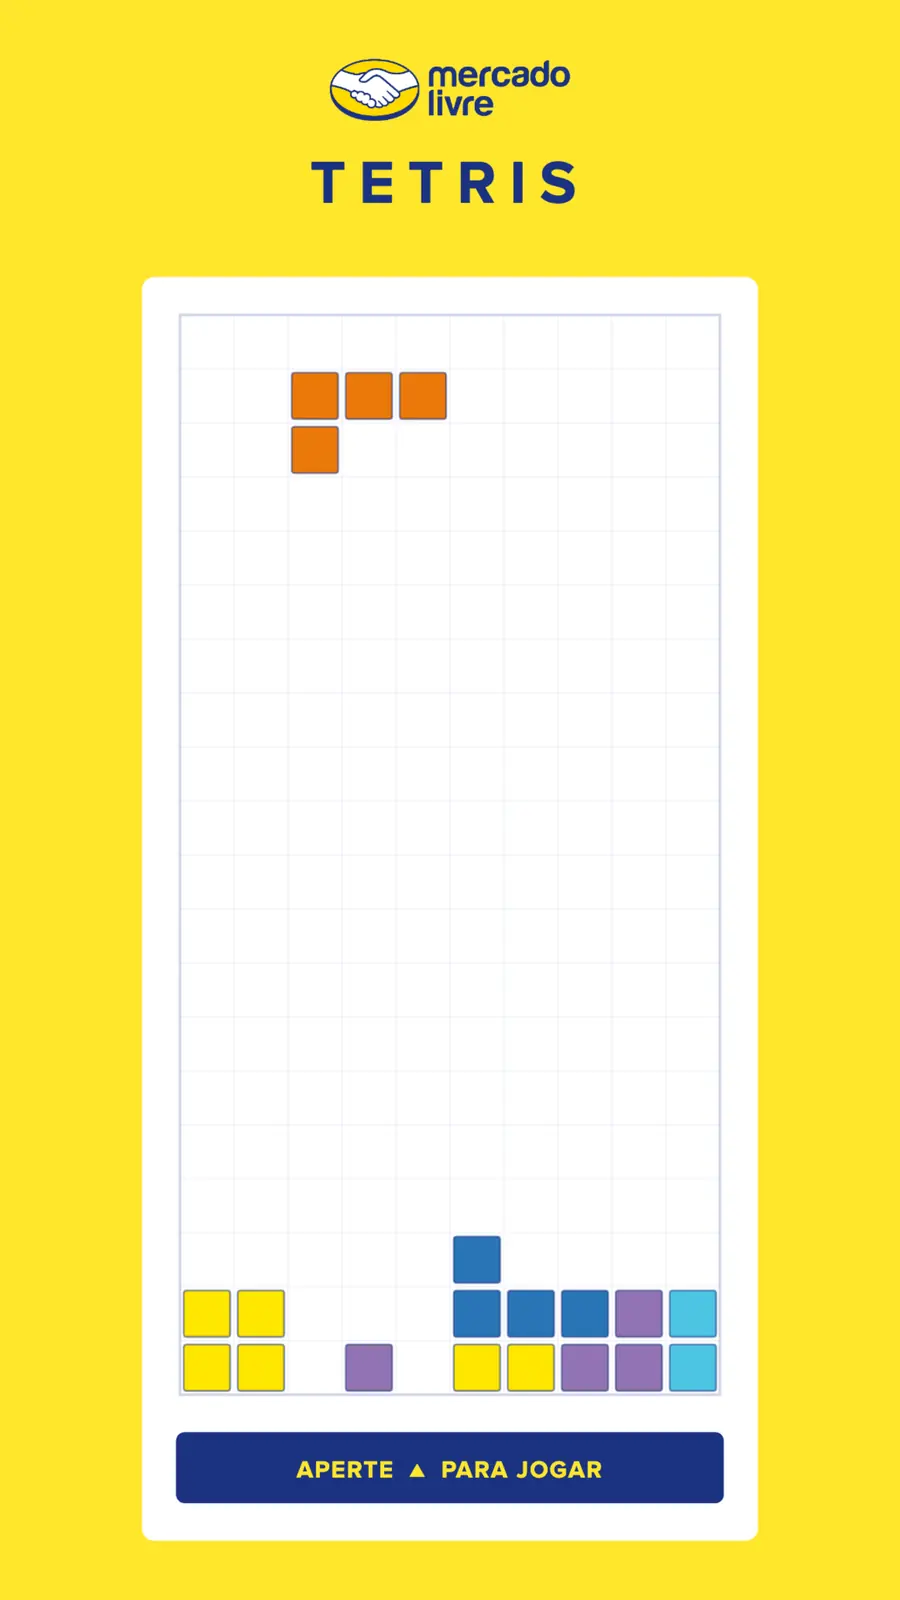
Concept, art and build, about three days per game. An Epson quiz on tablet, a Midea memory game on tablet and touch TV, and a Mercado Livre Tetris running on a Raspberry Pi arcade cabinet at an engineering fair at the University of São Paulo.

Epson
3 fairs
Midea
2 fairs
Built in
~3 days each
Data collected
None

No lead capture, by design: the brief was to pull people to the stand, and a form at the end does the opposite. Both clients re-booked, Epson for three fairs and Midea for two. The physical install of the arcade cabinet was done by a technician.

Midea quiz attract screen on a portrait touchscreen totem, showing four products.
Mercado Livre branded Tetris running full screen in the arcade cabinet layout.

Left: Midea quiz, portrait totem, four questions in under a minute. Right: Mercado Livre Tetris, arcade cabinet, attract mode playing itself.

My father's notebook, as software

Personal project

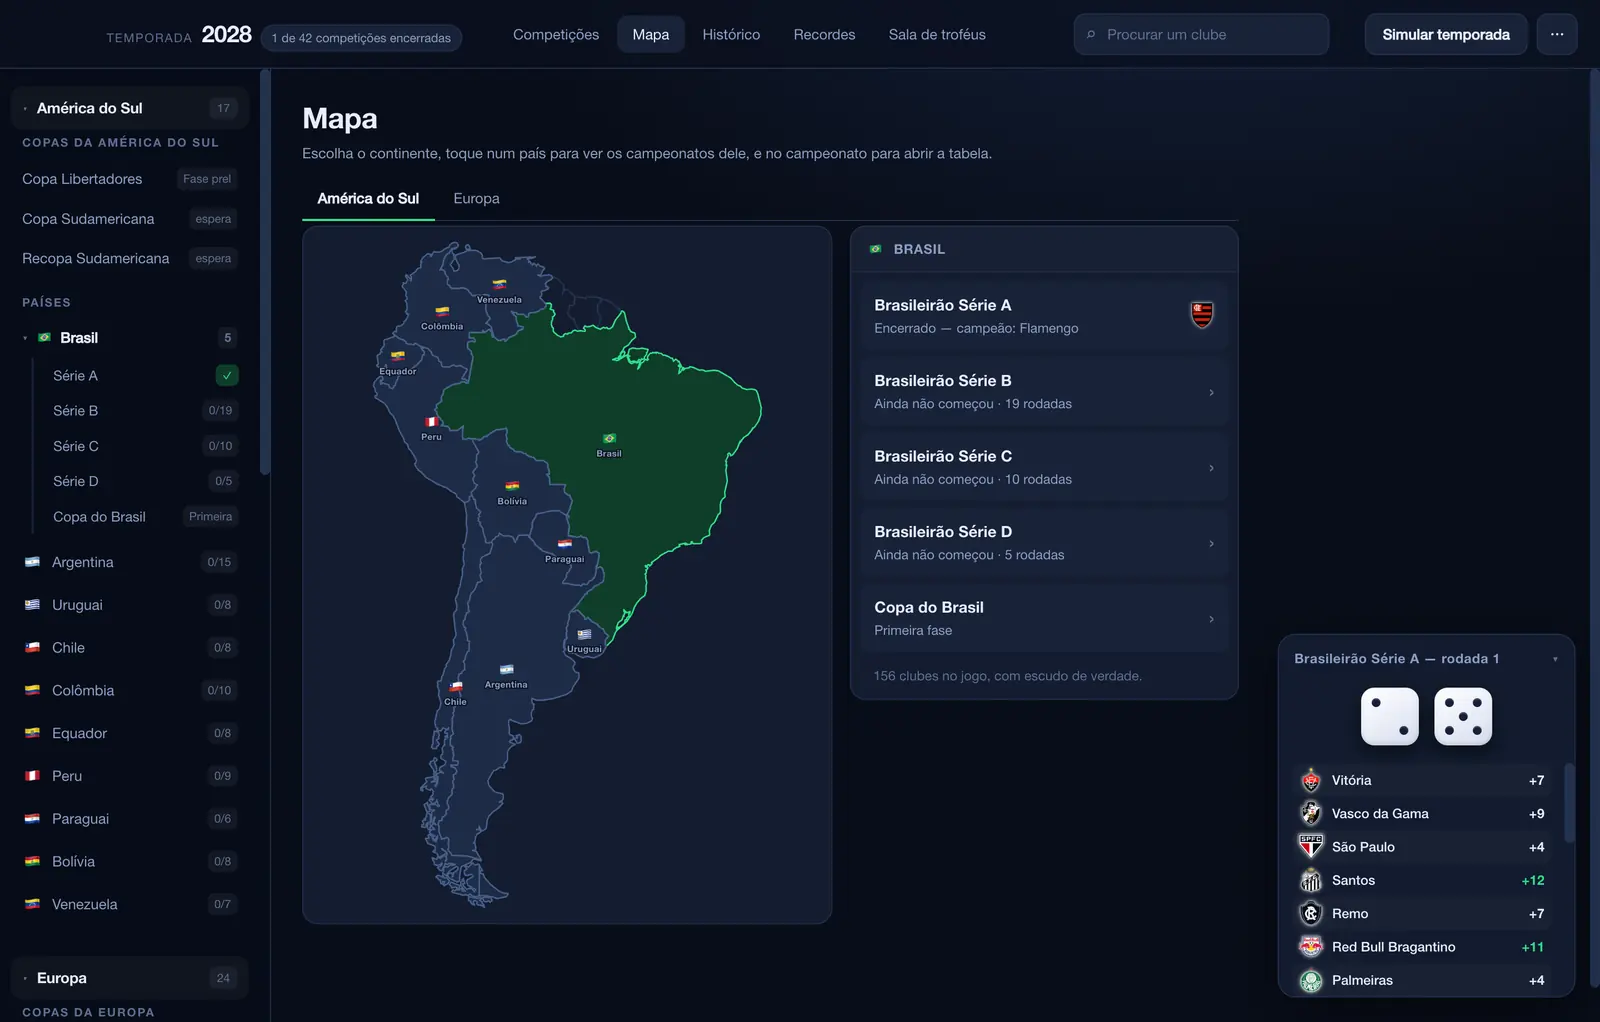
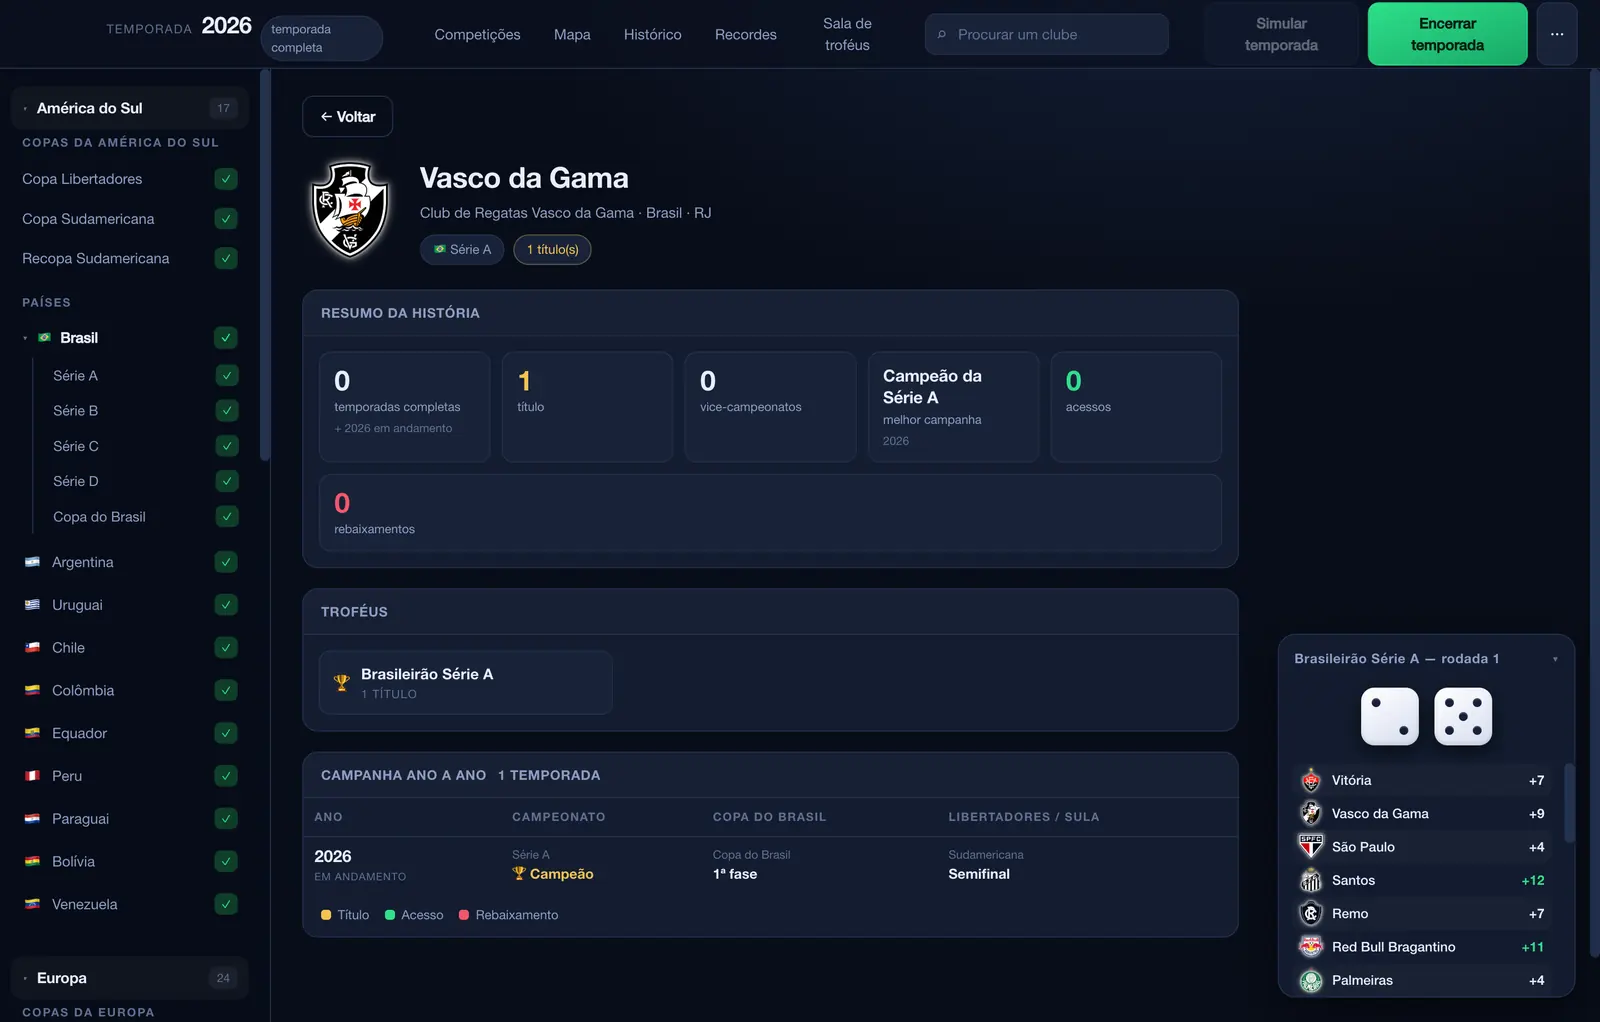
My father ran football seasons on paper, with two dice and a handwritten table. The software keeps that system intact and gives it room: 42 competitions, from the Brazilian fourth division to the World Cup, with real clubs and real crests.

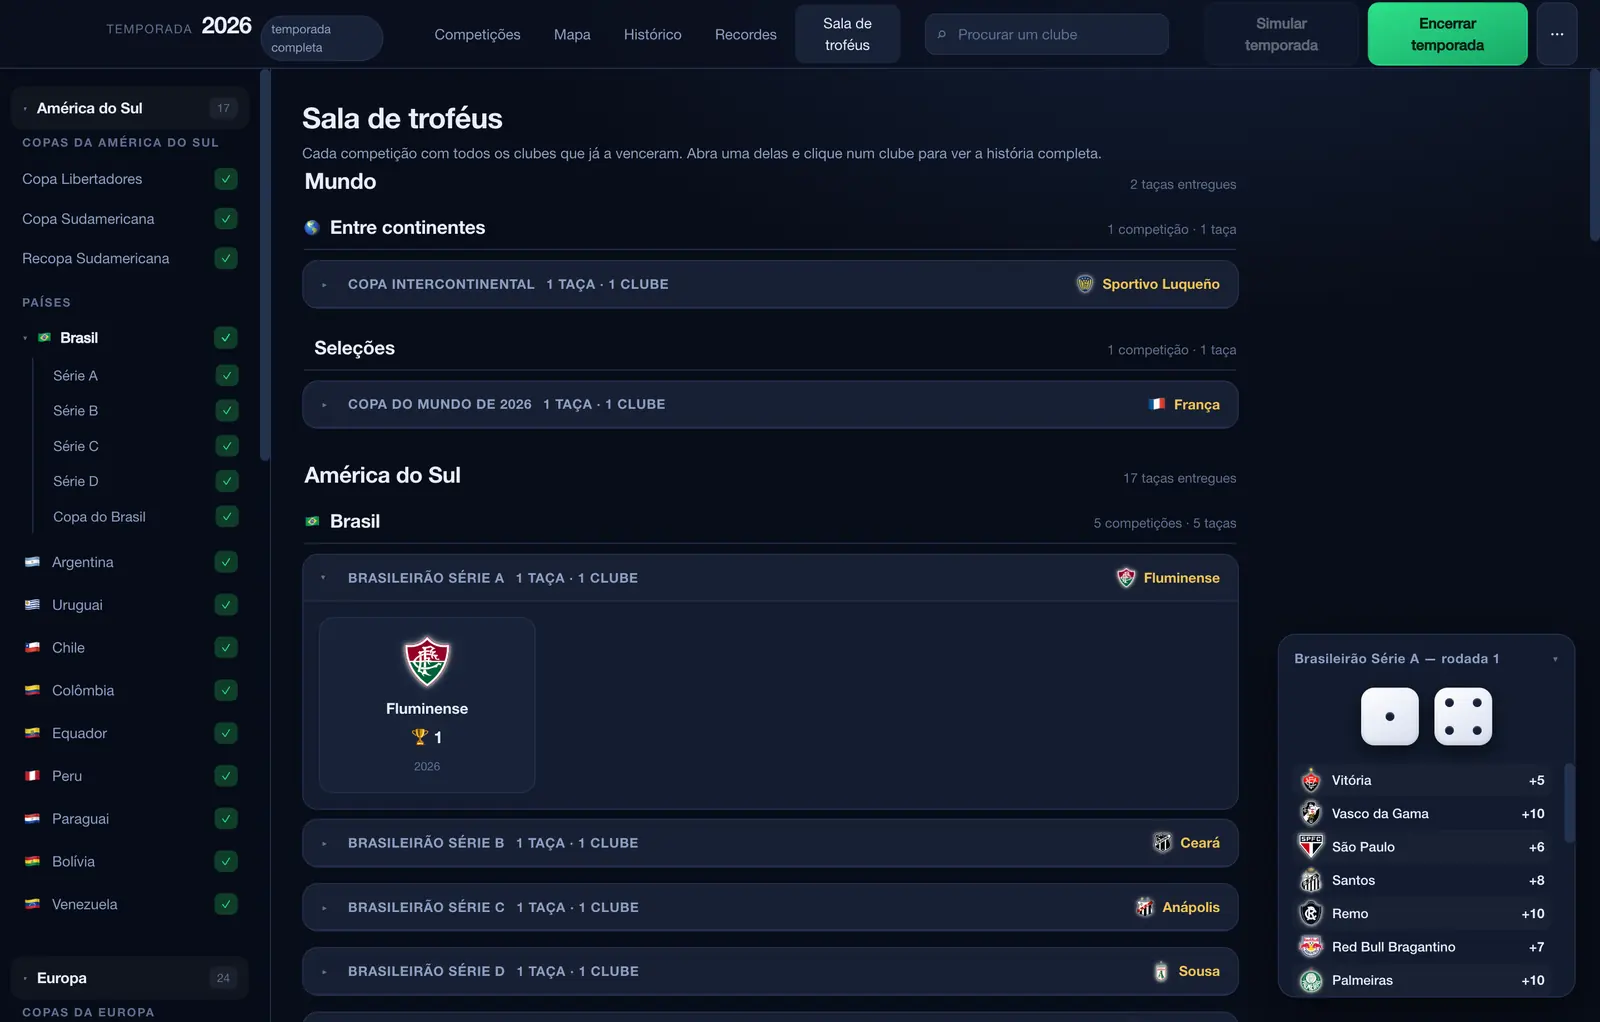
No team is stronger than another. The dice decide, exactly as they did on paper. What the software removes is the bookkeeping. What it adds is the map and the trophy room the notebook never had room for. Scale the process without erasing what made it worth doing.

Competitions
42
Clubs
156
National teams
211
Crests
642

Desktop app, no framework. The maps are hand-built SVG.

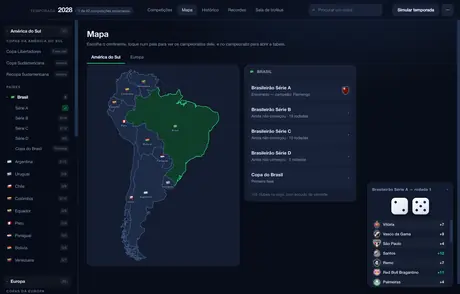
Map screen showing South America with Brazil highlighted and its competitions listed.

The map. Pick a continent, then a country, then a league.

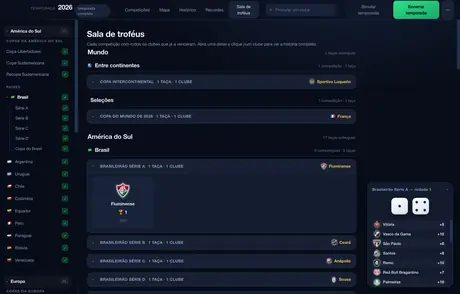
Trophy room screen displaying titles won across competitions.

Trophy room. Every title, by club and by season.

Club page showing squad, season campaign and history.

Club page. Squad, campaign and history in one place.

Where the visual judgment comes from

Roughly ten pieces a month across four concurrent accounts: social assets, large-format print, train and metro wraps, trade-show and activation materials. Eight years of deciding where a thing sits, how much air it needs and which detail carries the weight. Every interface decision further up this page is downstream of that.

Brands behind that work

How the work runs

Research

Reading the current process, sitting with the people running it, and writing down the constraints that will end up deciding the interface. A technical course in logistics is why weight, cargo volume and vehicle rotation showed up in the routing system instead of a generic distance calculation.

Structure

Folders, documents, context files, rules and agents, arranged so the project stays legible to another person, to a model, and to whoever opens it a year from now. This is not administrative overhead: it is what makes an AI-assisted project maintainable instead of disposable.

Refinement

The first version exists to expose the next set of problems. The button that works but never says so, the transition that lies about what just happened, the latency nobody budgeted for. That stage, after something is already functional, is the best part of the job.

Languages

Portuguese

Native

English

B2

Technical documentation, written specification and day-to-day project correspondence, without a translator. Speaking is the part still in training, which is worth stating here rather than discovering on a call.

Spanish

Basic

Tools

Design

  • Photoshop
  • Illustrator
  • Figma

Build

  • Claude Code
  • TypeScript
  • React
  • Vite
  • Next.js
  • Electron
  • Tailwind
  • Leaflet
  • PHP
  • Python
  • PostgreSQL
  • Supabase
  • Raspberry Pi

AI belongs in the same category as Photoshop: enormously capable, and completely dependent on whoever is holding it. It does not decide what the problem is, which constraint matters, or whether the result is any good. The production code here is written with AI. The reasoning, the structure and the judgment about what ships are not.

Bring a problem, not a brief.

The best first message is a process that is not working and a description of how it currently runs. Freelance, remote, in time zones from UTC-8 to UTC+2. Written English at B2, no translator in between.

  • Freelance, project by project
  • Remote, based in UTC-3